Rosie Williams
Email address
moc.liamtoh@smailliwesoreisorWeb Portfolio
rosiewilliams.cargo.siteBiography
Hello, I'm Rosie. My work is often experimental with a focus on realising outcomes from collected data.
I like to take references from environments that interest me and use them to inform my work. I am also strongly influenced by psychological behaviour. I like to translate this through my work by creating outcomes that promote a better understanding of conceptual subjects (like mental health) and make them more accessible by visualisation techniques.
I enjoy working with a variation of digital and analogue mediums, with emphasis on traditional printing processes like screen-printing and digital processes like motion graphics.
Portfolio
Phone Data Visualisation
A series of animations generated using data extracted from individual's phones, based on their screen time and data usage. The project's aim is to depict the addictive nature of screens and the internet in today's society. I chose to use bold, monochromatic and morphed graphics to symbolise the distorting and hypnotic qualities of cyberspaces.
Halogen Zine
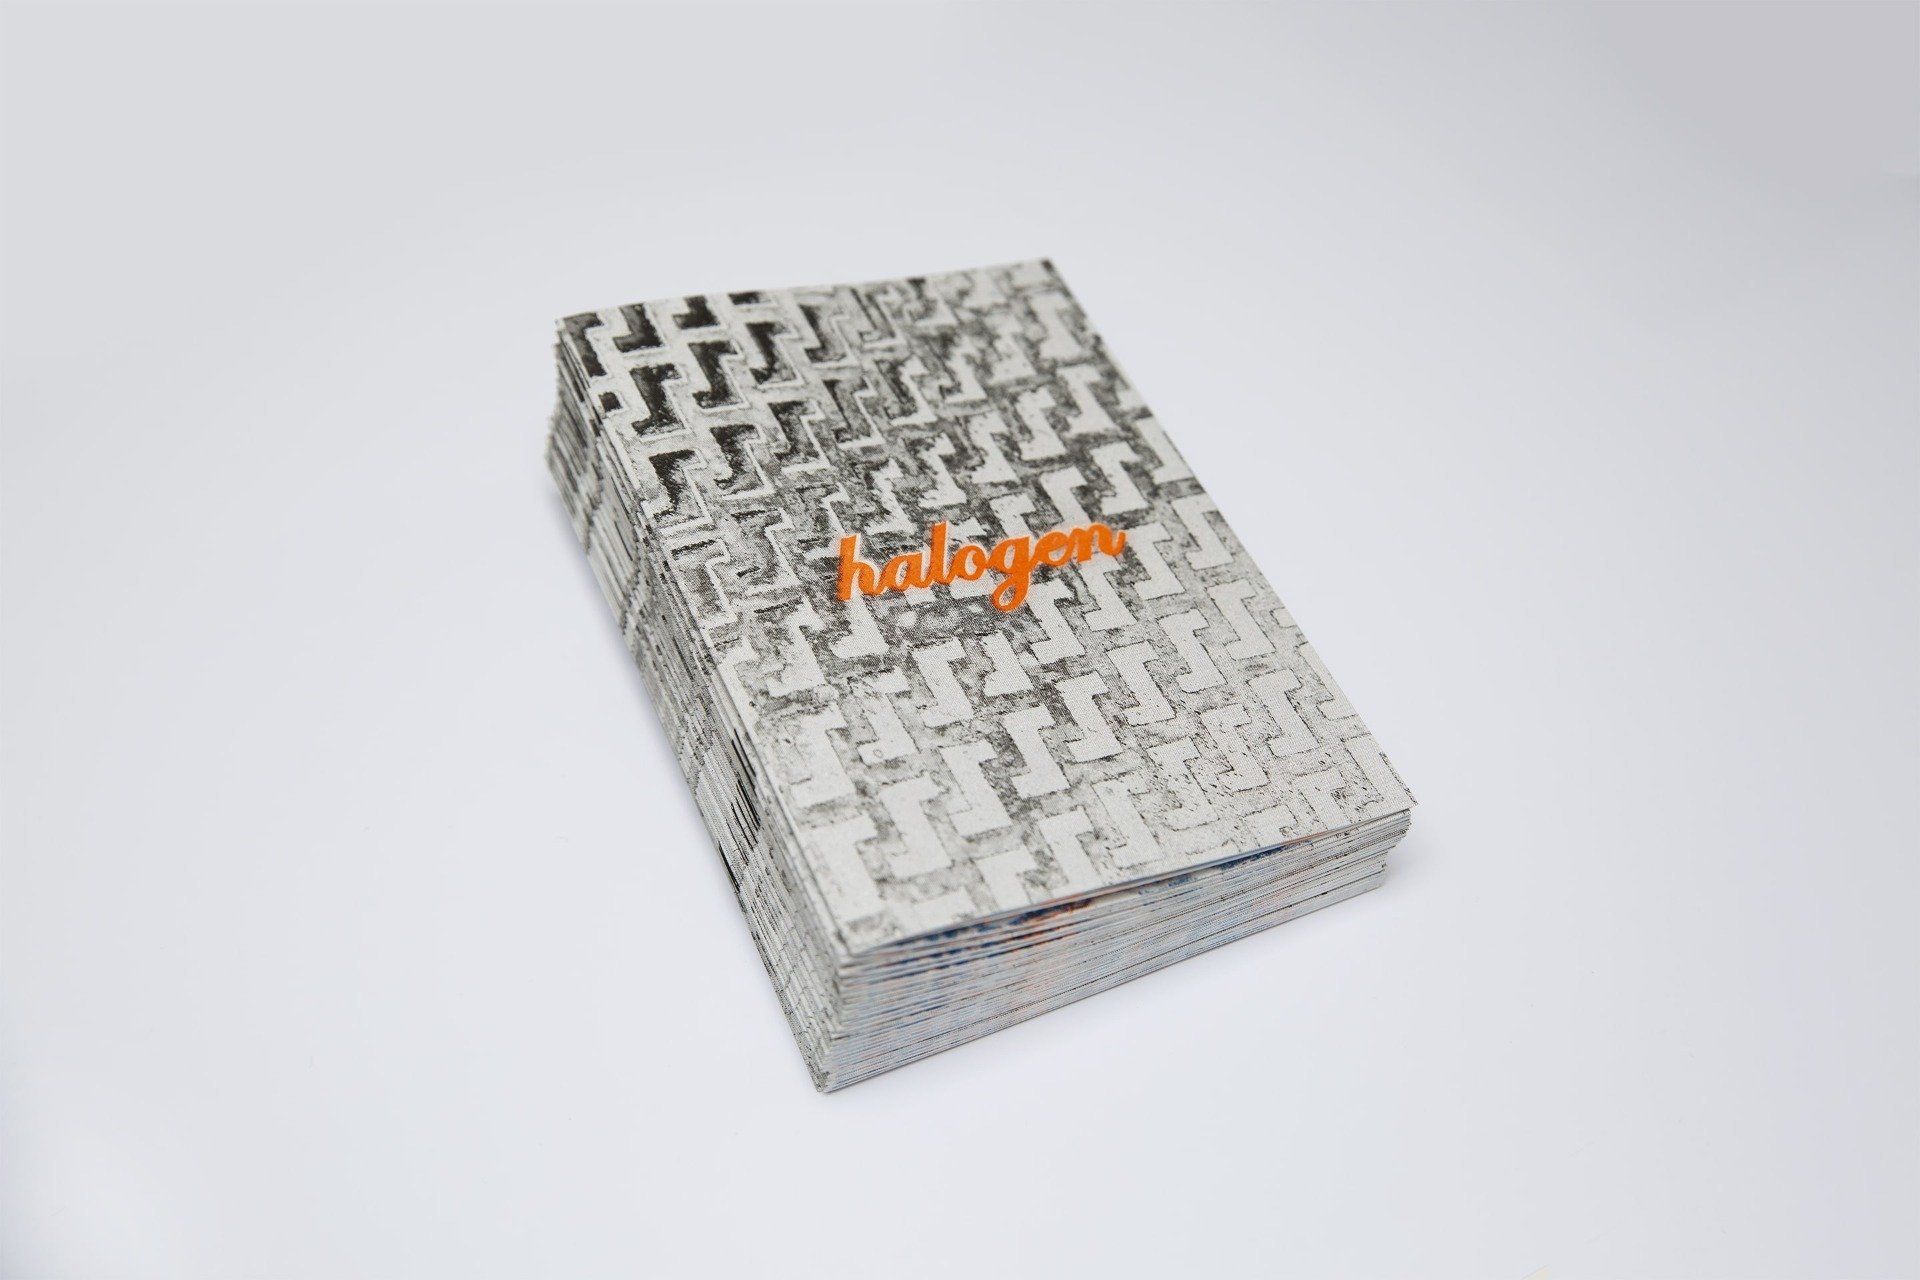
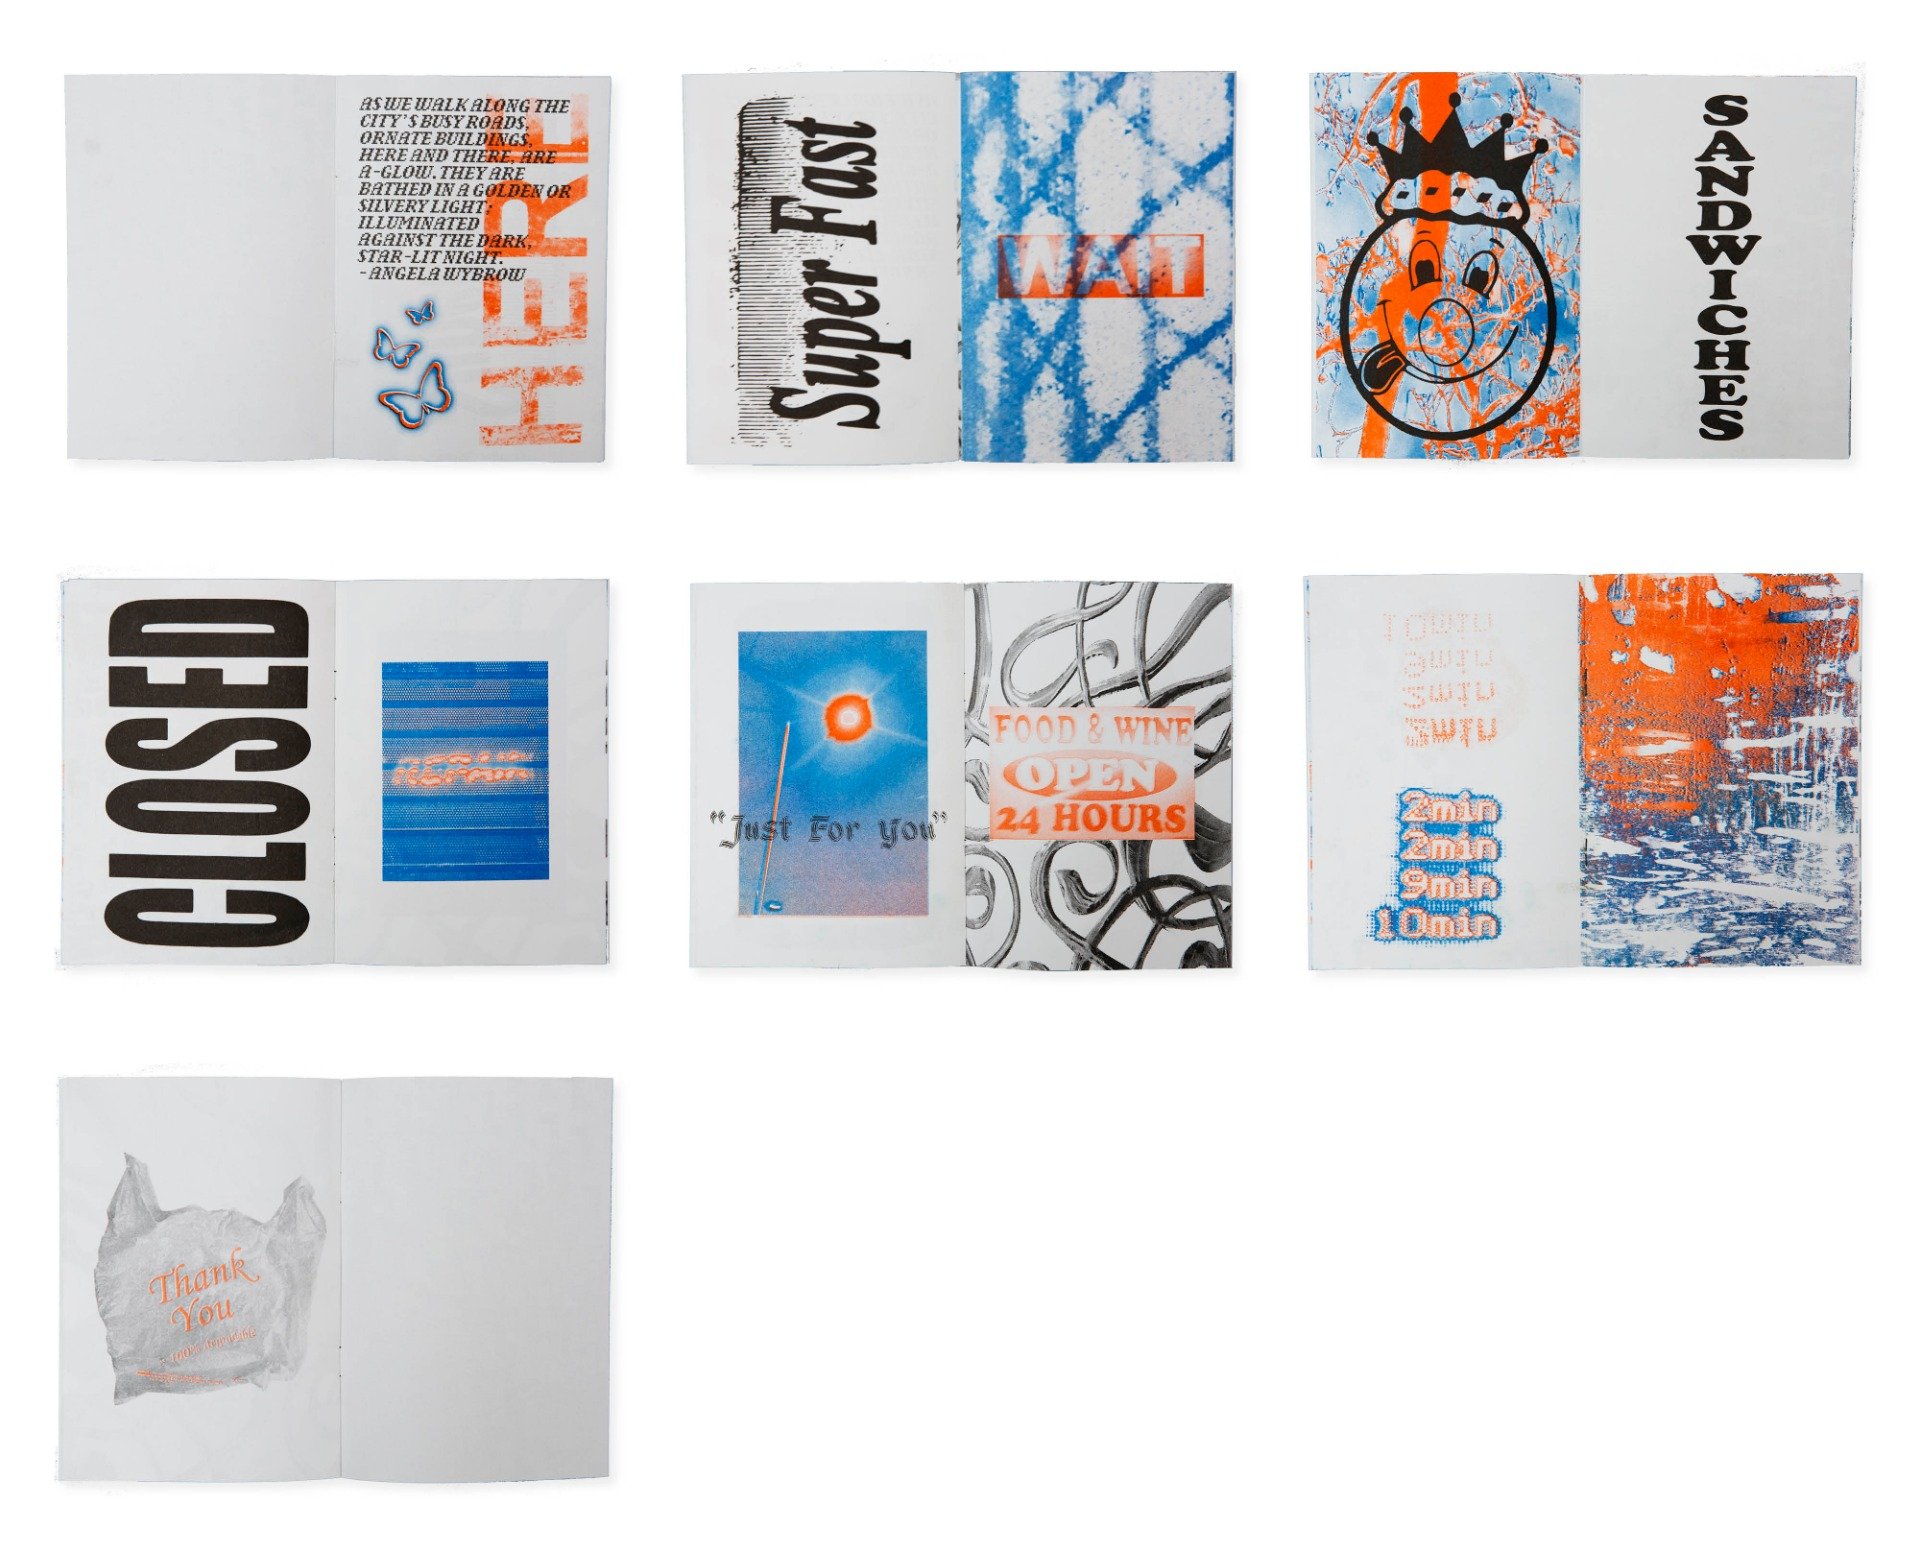
Halogen zine is a visual essay encapsulating both the melancholic and energetic atmosphere of London at night. Through a collection of images and graphics sourced from evenings spent in the city, its strong sense of character is presented. The zine shines a focal point on the city's imperfections and overlooked details as a way of celebrating how they contribute to the city's character. The zine acts as a recreation of a walk down a London street at night.
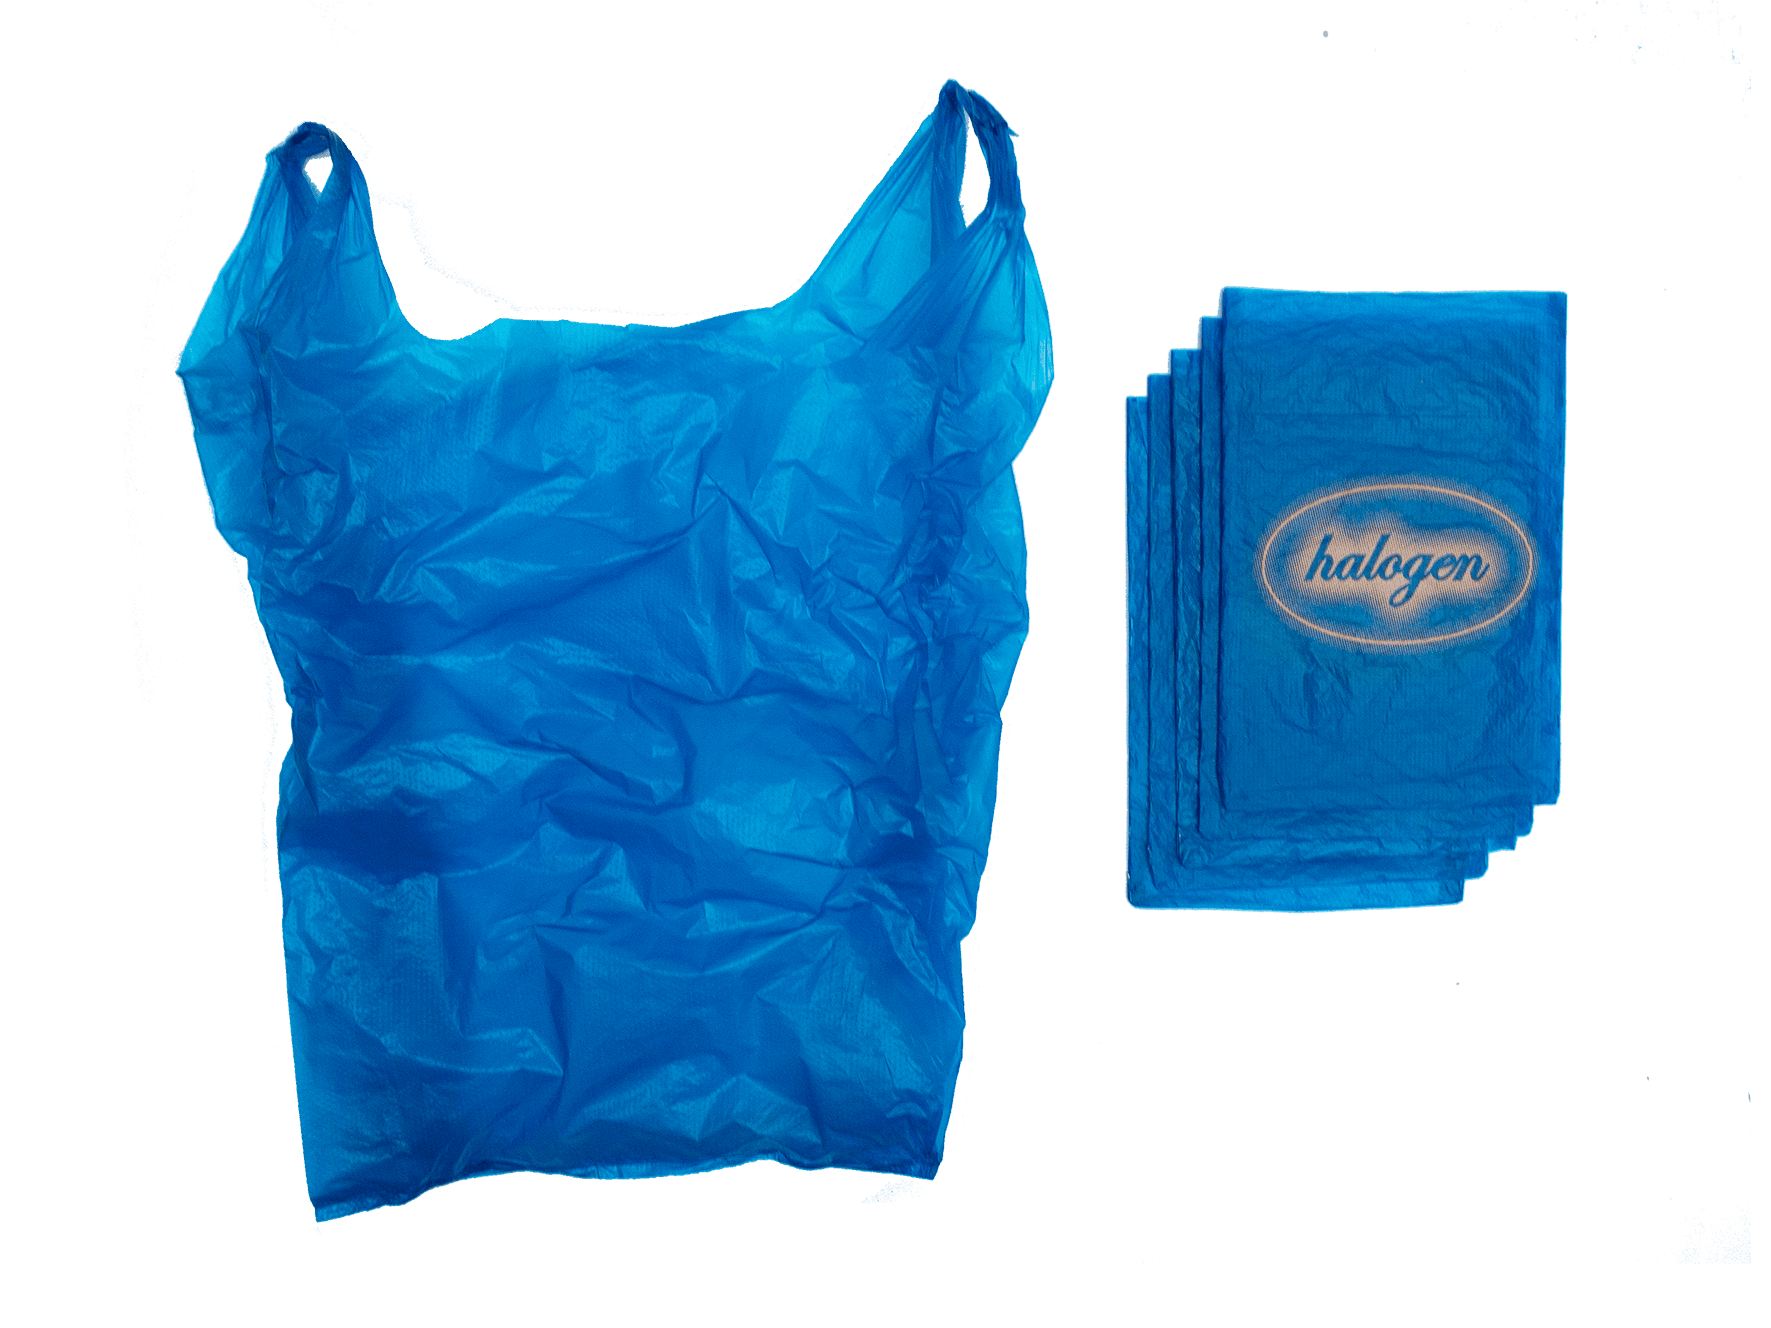
It is printed in three colours, using a risograph printer. The zine is also accompanied by handmade sleeves made from up-cycled plastic bags, featuring a screen-printed design.
Emotigraph
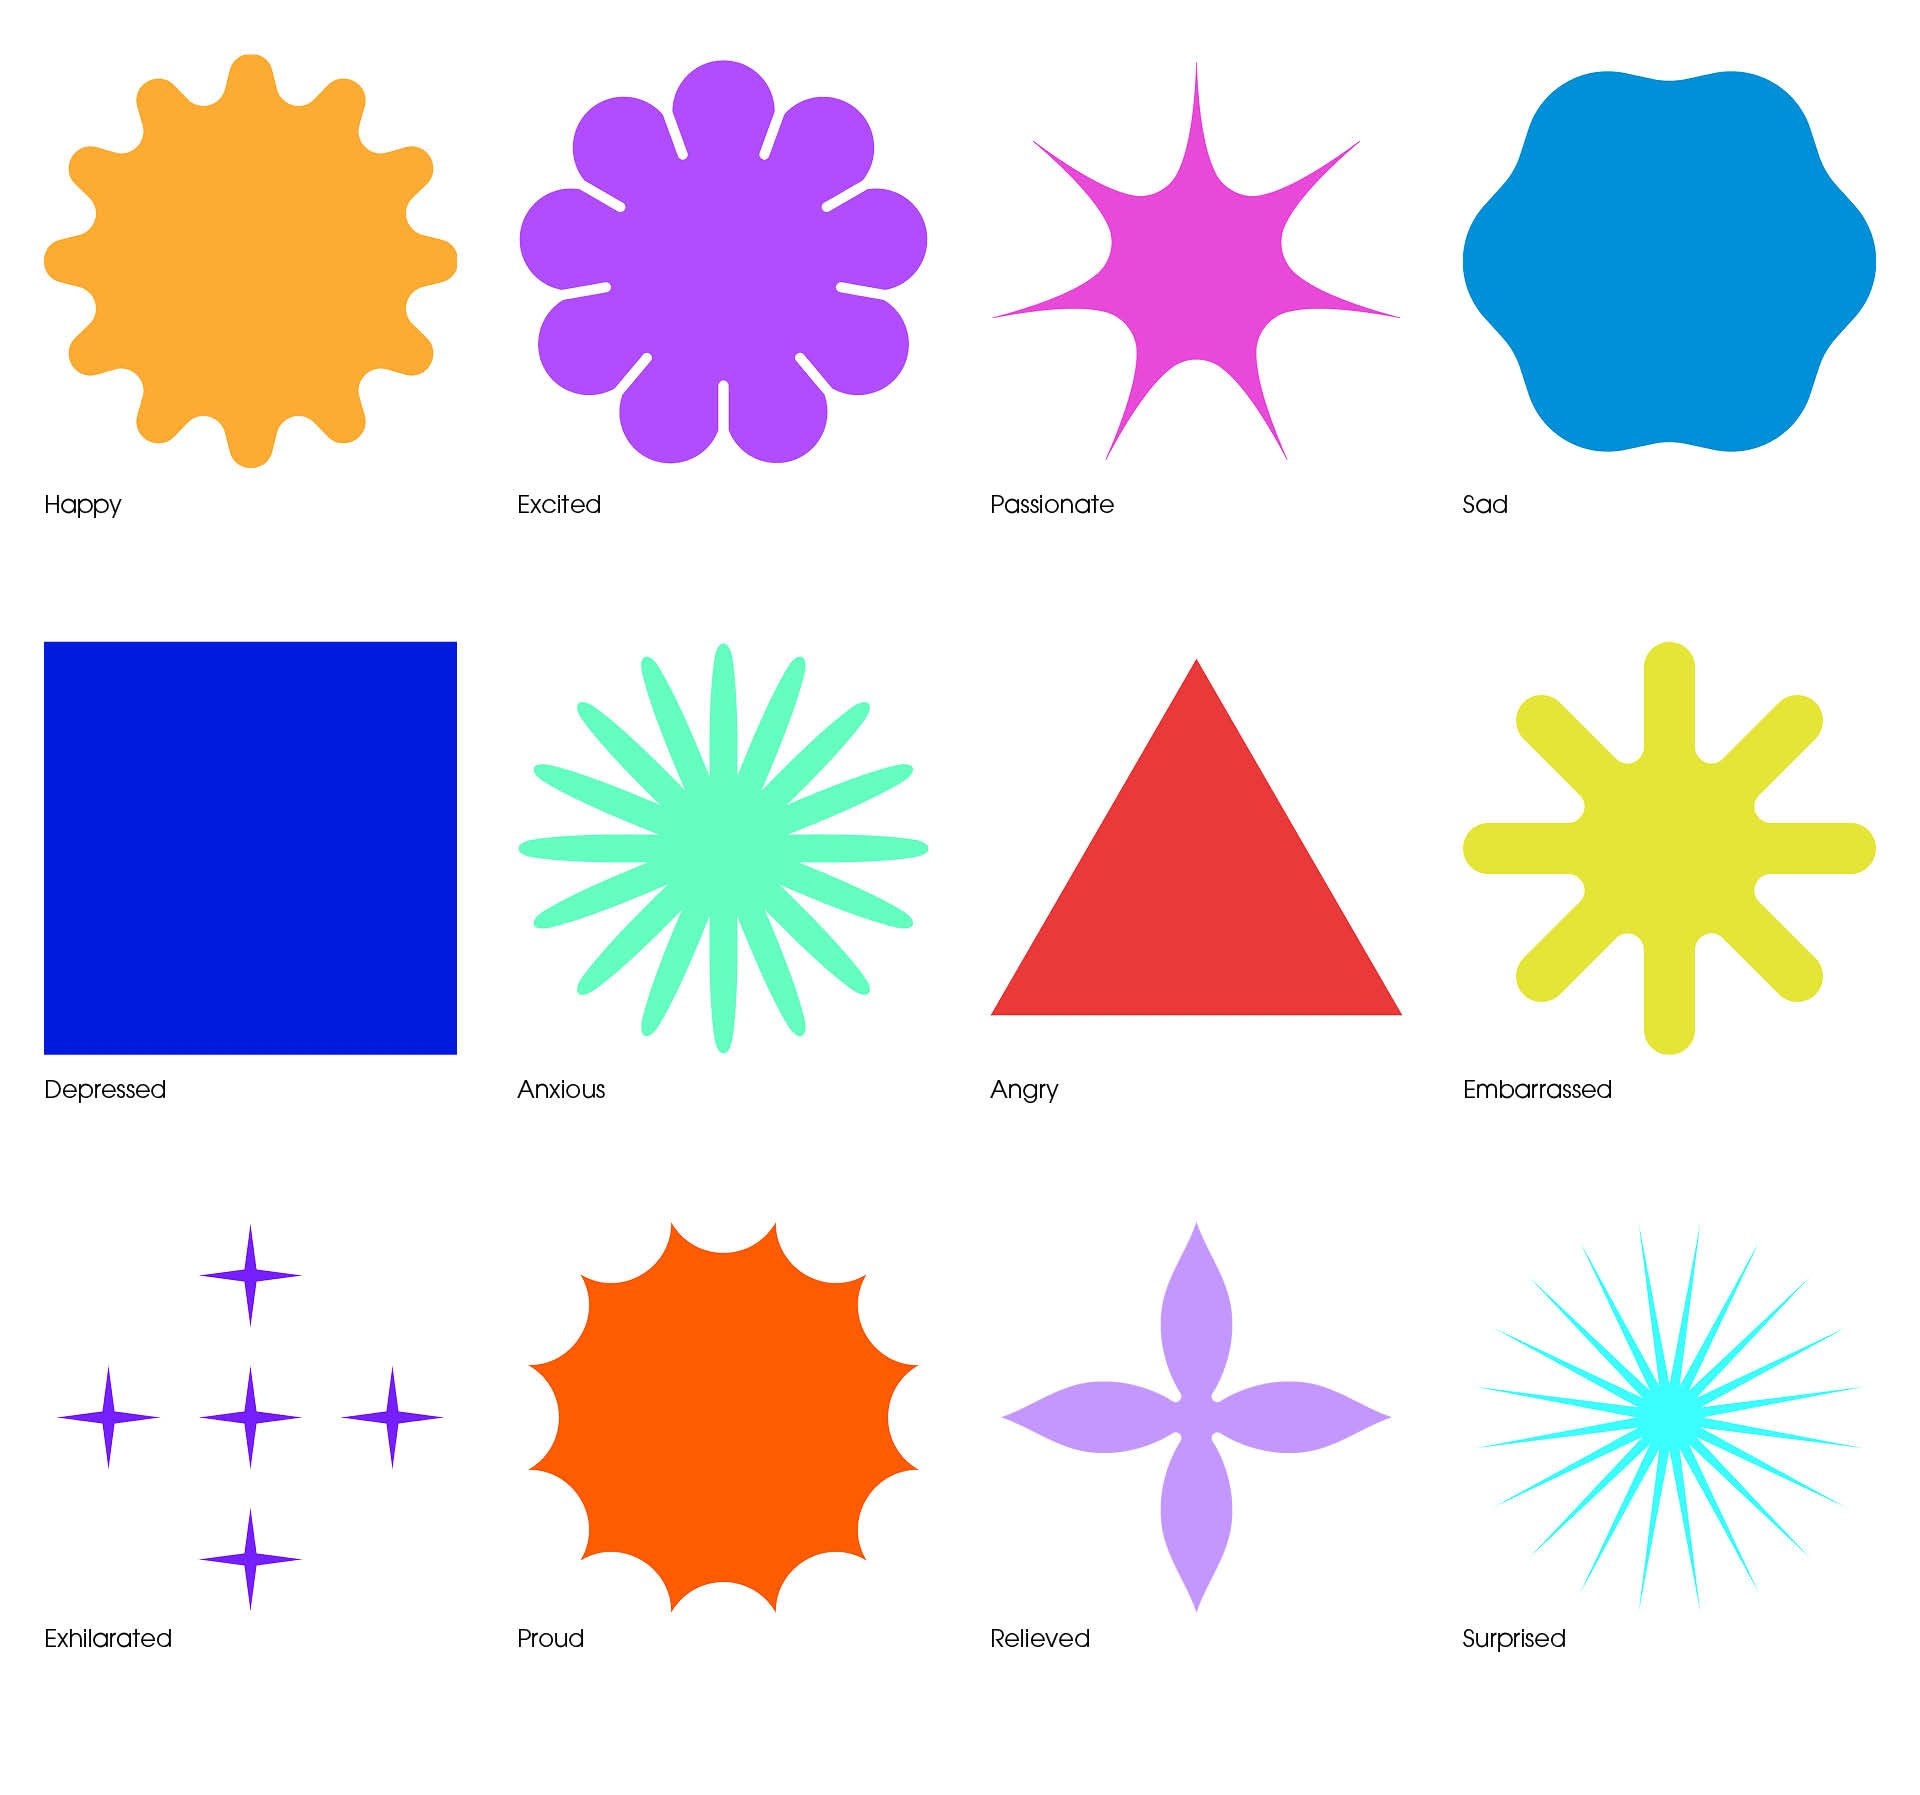
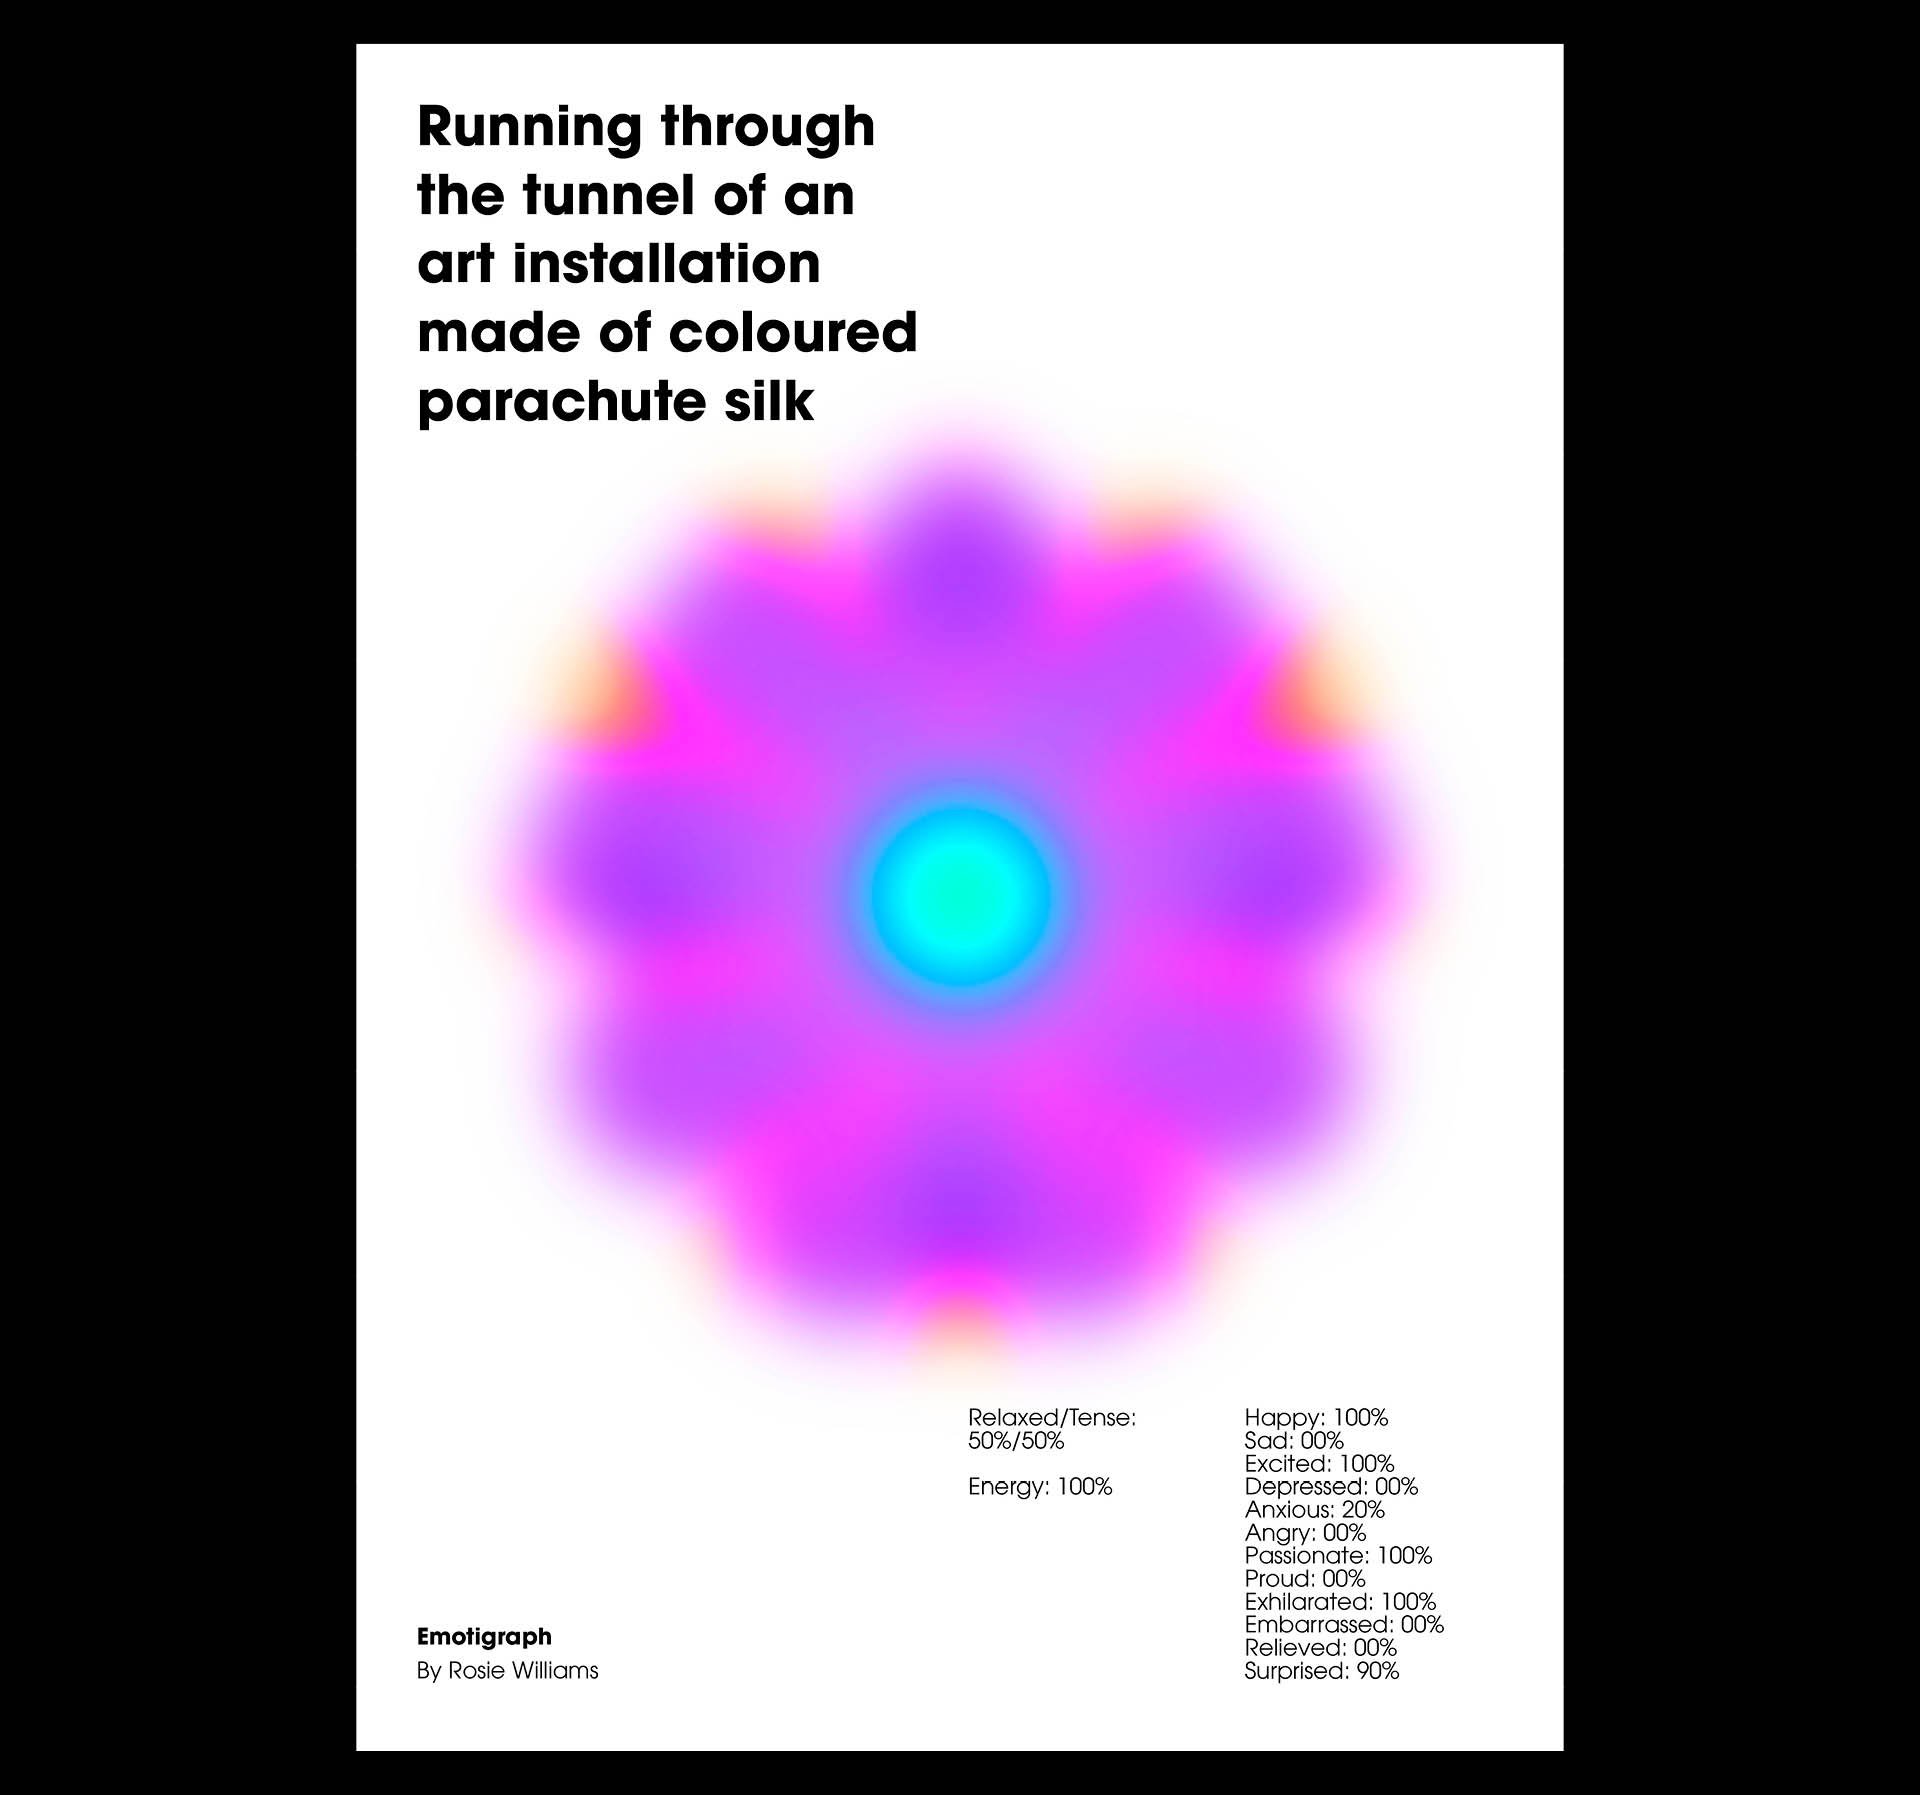
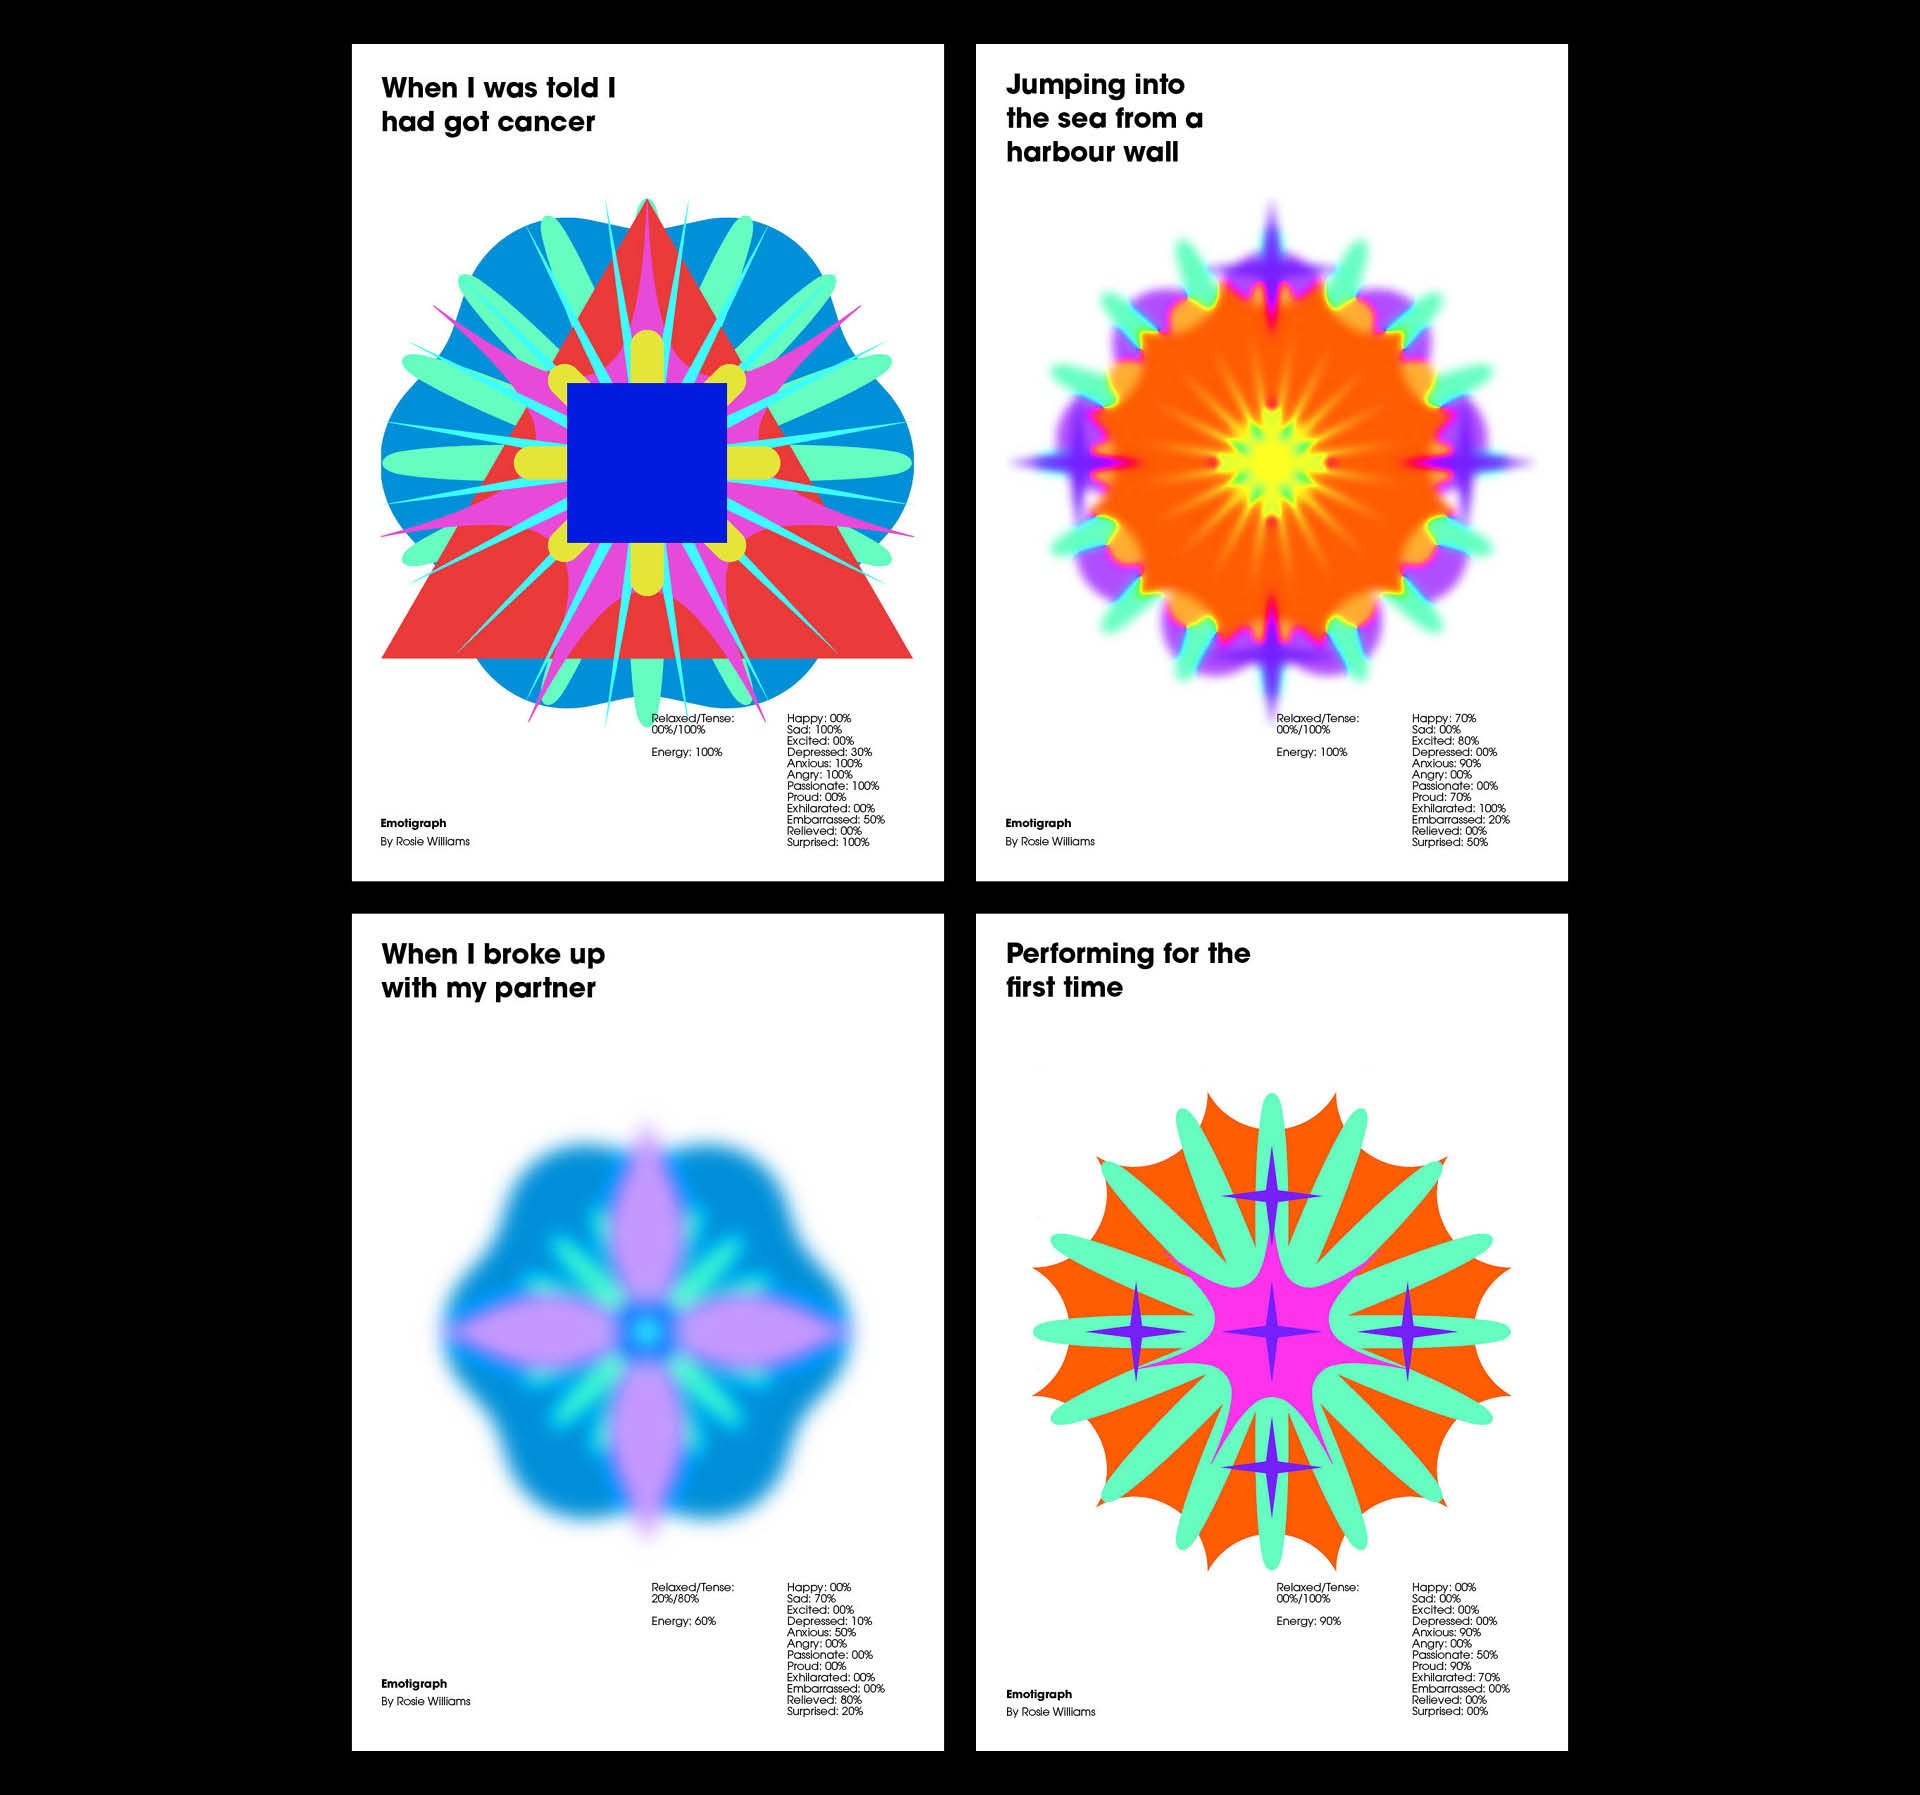
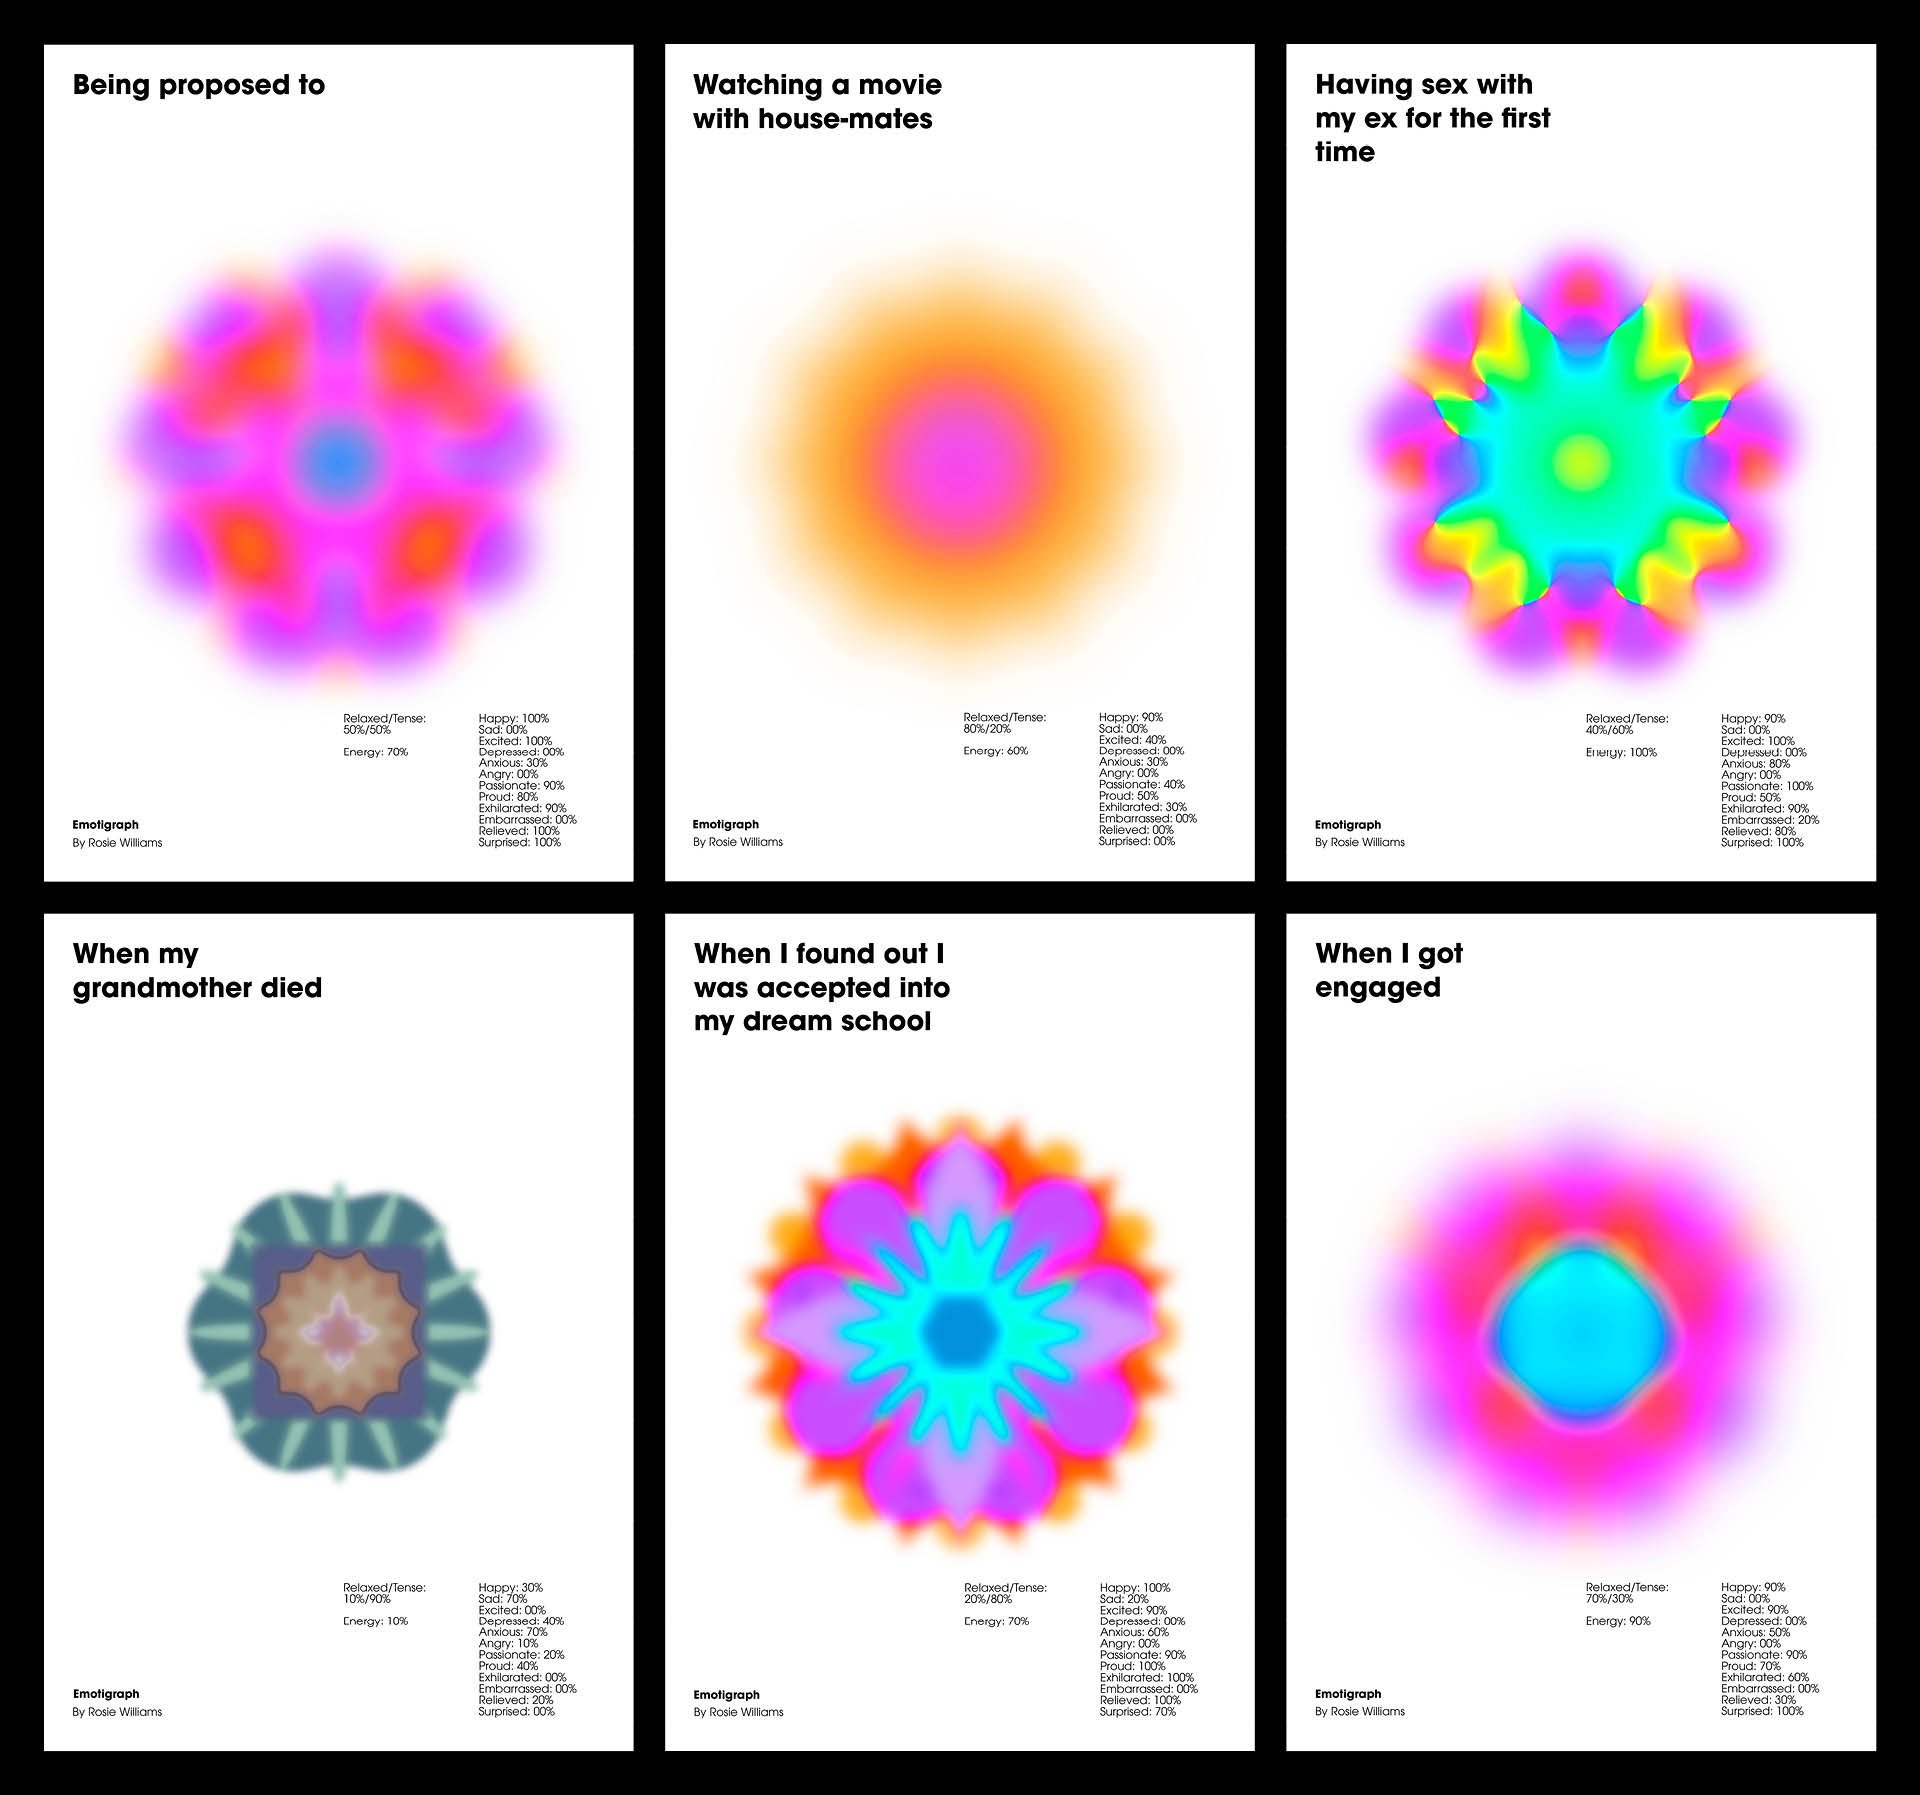
A series of visualisations informed by data collected about individual's emotions and physical sensations. The aim is to give more clarity when identifying one's mental state and help encourage people to be more mindful of their feelings and more compassionate towards themselves.
Additionally, the outcomes mimic the purpose of photographs, however using psychological data instead of visual data. This is because they capture and keep how you were feeling during a moment as you would capture a memory in a photo. They can also be used for learning purposes for people to reflect on how they were feeling at that time.
